
Based on your age, financial acumen, and financial position, you need to decide what particular investment strategy you need to adhere to. (beginner vs intermediate)
Anyone can get market returns with minimal work (invest in SPY).
Beating the market with lower relative risk is the toughest (creating alpha)
It’s easier than ever today to formulate a simplified plan and stick to it.
An investment strategy can be simple or complex. The fact is, that unless you’re a professional investor, you most likely do not have the adequate time or commitment to focus on investing. Regardless of your situation, you must realize that you’re investing for your own benefit. Today with minimal effort, you can still make reasonably sound investment decisions that benefit you. Generally, not investing your capital has material opportunity costs, therefore one needs to seriously consider investing a certain portion of their capital so that they can take advantage of investing and grow their capital wisely.
Every investment strategy should include the following three components that can add value to your portfolio. For beginners you can have a simplified process of implementing and for advanced investors you can develop your own complex or simple process to execute on the components below.
Beating the market by being risky is easy, although you will suffer in bad years.
Nothing will happen without a plan, commitment and focus.
The drivers of Alpha are Security Selection, Asset Allocation, and Market Timing.
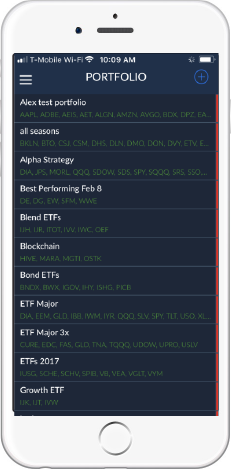
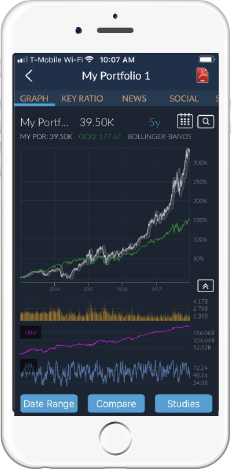
It is fairly easy to create your portfolio with Zsenia with a few simple steps.
Go to Portfolio and select the add icon on the top right
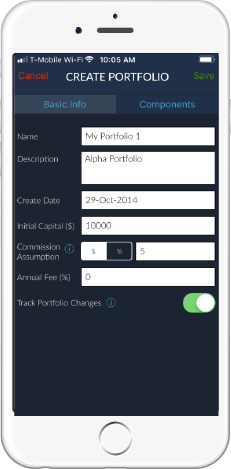
Complete
all applicable fields
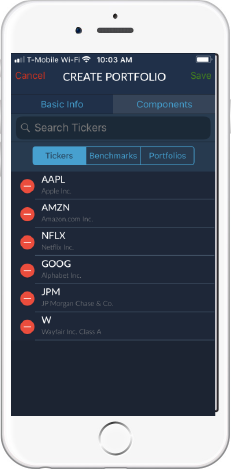
Add the components to your portfolio
Adjust the weights of
each ticker
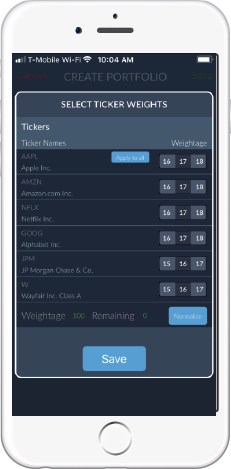
View backdated performance and
compare against any ticker
If you are a beginner and/or do not have at least 20 minutes to spare on a daily basis, you can follow a simple way to manage your investments i.e. Passive investments.
Instead of going through the painstaking task of analyzing and picking individual stocks, try to passively match the market. Past performance isn’t an indicator of future performance, but it’s all we have—and over the long term (20 years), the stock market averages about an 8% annual return. That’s pretty good!
Always remember that you are investing for the long-term and you must always set aside emergency funds in Risk Free accounts such as deposits in a Bank or short dated Treasury Bonds.
Your investment strategy can be broken into 3 simple steps:
The best way to get started investing is to choose a few index funds. An index fund is a collection of stocks or bonds that aims to mirror a specific portion of the market. They’re great because they have particularly low fees (or expense ratios). That coupled with the fact that they attempt to match the market, may mean higher returns for you over the long term. You can invest in the SPY 500, NASDAQ 100 or a combination of both depending on your risk tolerance. Over the last 20 years, the S&P 500 and the NASDAQ 100 on average returned approximately 8% and 12%. However, the S&P 500 volatility is 66% of the NASDAQ 100. Therefore, individuals must adjust allocation to the S&P 500 vs. NASDAQ 100 according to individual risk return expectations.
The S&P 500 is an American stock market index based on the market capitalizations of 500 large companies having common stock listed on the NYSE or NASDAQ. The NASDAQ-100 is a stock market index made up of 103 equity securities issued by 100 of the largest non-financial and top growing companies listed on the NASDAQ. Both indices are market capitalization weighted, positioned perfectly to capture the market momentum and reduce rebalancing needs significantly.
A little more than a third of all assets in the U.S. are in passive funds, up from about a fifth a decade ago. A 2016 study by S&P Dow Jones Indices showed that about 90 percent of active stock managers failed to beat their index targets over the previous 1-year, 5-year and 10-year periods; fees explain a significant part of that underperformance.
Most beginners will find that the best way to own stocks is through an index fund that charges minimal fees. Those following this path are sure to beat the net results (after fees and expenses) delivered by the great majority of investment professionals. Over the last 20 years, the S&P 500 and the NASDAQ 100 on average returned approximately 8% and 12% respectively. Some actively managed funds might crush the market some years, but in the long term, they’ll likely underperform. And the reason is simple: it’s hard to pick winning stocks and time the market just right on a consistent basis, even for professionals. Hence, investment through funds based on indices such as the S&P 500 and the NASDAQ 100 are ideal for investors in their early stages, in terms of experience. It is not only wise, but it is also cost efficient.
Over the last decade, the NASDAQ 100 has significantly outperformed its competition, although the index is inherently riskier due to its tech composition. This makeup is suited more for young investors who have a longer horizon. Investors who are closer to retirement shouldn't consider this a Core Holdings fund, given that more than 50% of its portfolio is invested in technology names. By way of comparison, the S&P 500, which is a terrific long-term holding, has only 17.5% of its portfolio invested in tech stocks. As a result, the S&P 500 is perfectly suited towards investors with a short to medium horizon.
Generally, your allocation depends on your age, risk tolerance, and investment goals and there is no magic number.
However, a common rule of thumb that you can consider:
110 - your age = the percentage of your portfolio that should be stocks
So, if your 30, you’d put 80% of your portfolio in stocks or risk assets (110 - 30 = 80) and the remaining 20% in lower-risk, risk free bonds or equivalent investments. If you’re more conservative, you may want to put 30% in bonds instead. It’s up to you, but this is a good starting point.
Then, as you grow older, you should adjust your asset allocation accordingly. So, if you’re following the 110 rule above, you’ll want to buy more bonds when you’re 40, so that you have 20% in bonds instead of 10—the idea being that, the closer you get to retirement, the less volatile your portfolio becomes.
During the start of recessions, depending on your risk appetite, your allocation to risk assets should be materially reduced. For instance, if recession is underway, you may sell some or all of your stocks and purchase more Treasury and Risk Free assets to take advantage of what may be a "peaked" market for stocks and the beginning of a boom for Treasury Bonds. Needless to say, perfect Market Timing is very difficult for even an experienced investment professional. However, conceptually understanding the logic can help any investor reduce risk in their respective portfolios. It is also equally important to reenter the market once the recession has peaked and the economy is in recovery mode.
Obviously, our allocation to equities (the SPY 500,NASDAQ 100 or a combination) should be reduced as you grow older and your allocation to Bond Funds (e.g. tax exempted fixed income securities/municipal bond funds) should be increased over time.
If you’re content with market return, then you do not need to do anything during recessions. However, one should know with the application of a little bit of asset allocation techniques, you can potentially improve your returns during recession.
Zsenia Markets - Calendar, and an Economic section to track and review the most important Economic Indicators
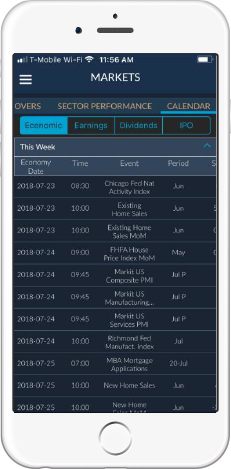
Therefore, once invested in a passive index such as the S&P 500 and NASDAQ 100, investors would still need to keep an eye on the macroeconomic trends of the economy to avoid any major recession.
The most important indicators to follow are:
There are many sources for economic news and key statistics. However, with the Zsenia app, you can track most of your market data and Economic Indicators in one place.
Changes in your asset allocation plan can be triggered by these signs of recession, downward trend on earnings, or anything that adversely impact risk assets. Based on such factors, any investor can reduce risk assets (from 70% to 30%) and increase exposure to risk-free assets (from 30% to 70%). This all depends on you risk return appetite.
Even if you cannot time the start, peak and end of a recession, by simply reducing your risk assets in the early stages of a recession and reallocating your capital at the late stages of the recession, you can potentially improve your return Risk profile over time. You must remember recessions and downturns create the biggest opportunity of all. This is because of the correlation across markets and as you may know from the past, when the market goes down, many good assets go down as well and this provides the greatest buying opportunities.
Regardless of your allocations at any given time, the secret to success is to contribute equal amounts consistently each month to your portfolio so that your average investment price is reasonably attractive over time. Investors should budget to invest fixed amounts of money at regular intervals, because over time these savings add up. This allows you to invest a set amount of money regularly without the additional worry of timing transactions with the financial markets. As a result, you are able to buy more units or shares when prices are low and fewer when prices are high. This principle is called "Dollar Cost-Averaging". Making the decision to save small amounts regularly over a period of time helps you to maintain a regular investment plan, and be disciplined about saving. It is important to note that this type of savings doesn't necessarily result in a profit, and does not protect you against financial loss when markets are not doing well. It also removes emotion from the process, as you purchase the same dollar amount every month regardless of price. If the stock has gone down, you get more shares for the same amount of money.
As a professional investor, you always have to keep one thing in your mind- Your ultimate objective is to outperform the market.
There are primarily only 3 ways you can generate Alpha - security selection, asset allocation, or market timing. For more professional and experienced investors, these three factors are continuous and evolving.
Beating the index is not an easy task. It is very difficult (but not impossible) to outperform the market (eg. S&P 500 Index) for anyone thinking about buying individual stocks and bonds. You may know already that roughly 1 in 20 actively managed domestic funds beat the index funds they track (according to Standard & Poor’s research). Over the last 15 years, 92.2% of large-cap funds lagged a simple S&P 500 index fund. The percentages of mid-cap and small-cap funds lagging their benchmarks were even higher: 95.4% and 93.2% respectively. In other words, the odds you’ll do better than an index fund are close to 1 in 20 when picking an actively managed domestic equity mutual fund.
There is no magic to beating the index but you can use certain proven strategies that may work. For instance, you can beat the S&P500 or NASDAQ 100 by potentially slightly overweighting securities that you deem may outperform the index and conversely underweight securities that you believe will perform unfavorably. These criteria could be simple or complex. It is not that difficult to evaluate analysts’ ratings that encompass the overall outlook of the security as well as the outlook of the industry. You can apply your filtering criteria every month or quarter to rebalance your portfolio. Under this process, you can own the entire market (S&P 500) but your weights are different from that of the Index. Do keep in mind, depending on the strength of your criteria and the level of deviation from the index, you can materially outperform or underperform the benchmark.
For the investors who are well acquainted with the market, tactical asset allocation should be considered from time to time. At such a time, a Core Holdings-Trading portfolio could be implemented. Core Holdings-Trading Portfolio Management is an investment strategy that breaks a portfolio into two portions: the "Core Holdings" and the "Trading".
The Core Holdings portion is meant to capture the markets returns as efficiently and economically as possible. The Trading portion comprises actively managed securities intended to boost the portfolios’ returns and capture market outperformance. These types of investments can be utilized via individual stocks or ETFs. The portfolio is designed in this way to reduce risk through diversification, while outperforming a standard benchmark for performance such as the S&P 500 Index.
There is no magic process to building your portfolio. However, if you own individual stocks in your core holdings, you should be diversified across 5-10 individual stocks that are general less correlated. Similarly, it is prudent to diversify your Trading Portfolio across 3-5 ETFs, 5-10 individual stocks or a combination of both. Bottom line is that you need to be diversified across your risk portfolio (Stocks and ETFs).
Generally over time your Core Holdings should represent the majority of your portfolio.
For generating alpha over the market, you need to focus mainly on the following:
As mentioned earlier, Security selection is the process of identifying individual securities within a certain asset class that will make up the portfolio. For identifying winners, you should conduct thorough fundamental as well as technical analysis on companies or ETFs. There are many ways you can structure your security selection process.
Generally, to identify winners, you can conduct thorough fundamental analysis on companies in the following manner:
Industry research and company research are important prerequisites for security selection.
Industry research is a very vital component of the fundamental analysis that you undertake for analyzing the stocks in your investment universe.
Identifying a growing industry is important. The process of identifying a growth industry is not complicated. Just look at the products and services used today that didn’t exist a few years ago. From Amazon to Netflix, these are all examples of Industry trends. A changing world brings new challenges and opportunities to companies and provides investing opportunities for all.
Factors to keep a close eye on:
In view of the fundamental aspect of stock investing, it is imperative to research specifically about the company, its business model, management, etc. You need to be on top of the qualitative aspects of the company. Factors to look for include but are not limited to the following:
Experienced investors can apply a dynamic and more robust Dynamic Asset Allocation process. Dynamic asset allocation is a process by which an investor dynamically allocates across assets or securities. These factors may include: economic views, industry views, risk factors, or anything that the investor determines provide early indications for certain outlook or expectations. For instance, if certain economic news favors certain industries, the investor may over-weight the target industry and simultaneously add more stocks that represent the market leaders within the industry. Alternatively the investor may just look at the sector ETF. As mentioned earlier, generating Alpha is hard work but it is certainly possible for individual investors to do so by setting up certain processes that include tracking key factors that facilitate dynamic asset allocation in order to improve performance over the benchmark.
similar to dynamic asset allocation, the investor can set up various market timing factors that can be utilized, not only to change allocations to sectors for a cross asset class, but also individual security selection or exclusion. These techniques could be fairly simple or complex. Individual users can set up these market timing parameters based on performance. Market timing is difficult and requires thoughtful evaluation as well as more frequent monitoring.
There are many ways you can find stocks that you may want to include in your portfolio. If you are just starting then first research the companies that you may know from its products and services. For instance, products from Apple (APPL), Amazon (AMZN), Netflix (NFLX), or AT&T (T) are generally widely used. First review the price-performance of stocks. Price-performance is one of the most powerful indicators of any company.
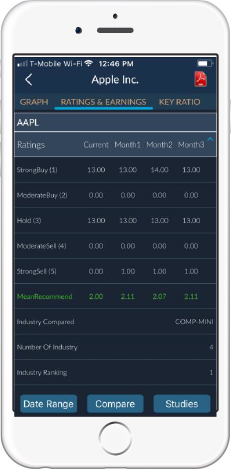
Price, in most cases, includes all available and relevant information that drives the stock price. Second you should always compare the company with the benchmark, for instance the S&P 500. If you do not have time to conduct in-depth research on the company, you can review the analyst ratings, which in most cases are reasonable indicators of the future outlook of the company. You can get all the necessary information from the Zsenia app seamlessly.
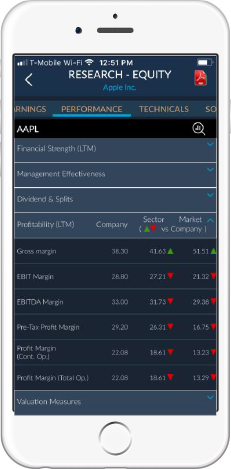
Additionally, you can review company financials that provide important information to consider as part of your company research.
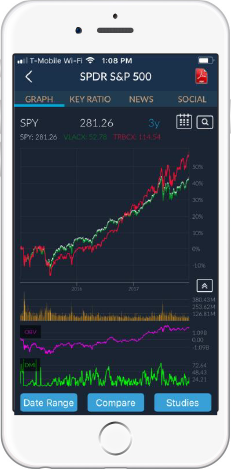
Price Performance is the most powerful indicator
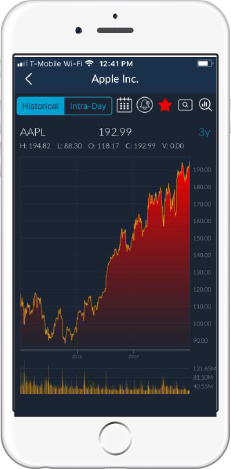
Price Performance &
Compare to Benchmark
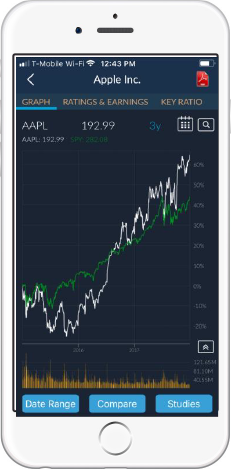
Review
Analyst Ratings
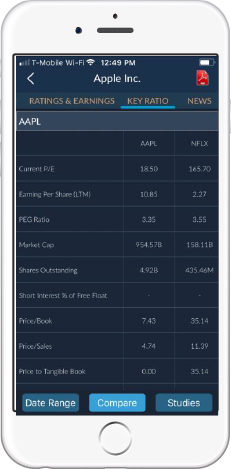
Key Ratios & Compare to
other Similar Stocks
Deep dive into financial ratios and
fundamental analysis
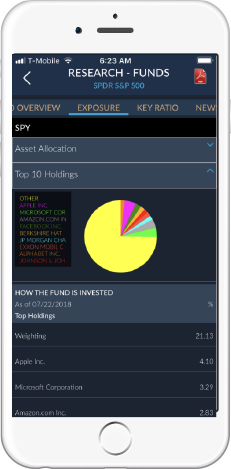
When you research a Mutual Fund or an ETF, the key factors include Price performance, underlying exposure, fees and expenses, and finally review of the performance and evaluate the funds ability to generate excess risk-adjusted return over a benchmark.
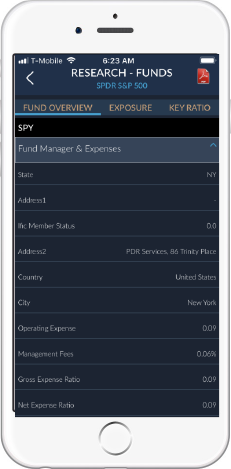
In addition to the above information and data, you can always look into Manager background information including a review of detailed information available in the ETF or mutual fund prospectus.
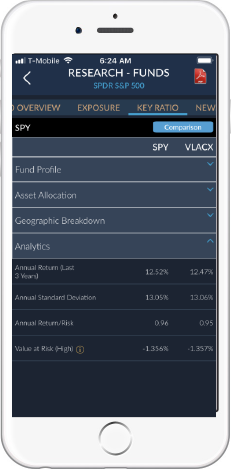
Compare your Performance
Underlying Exposure Details
Fees and Expenses
Key Ratios, Returns &
Key Risk Factors
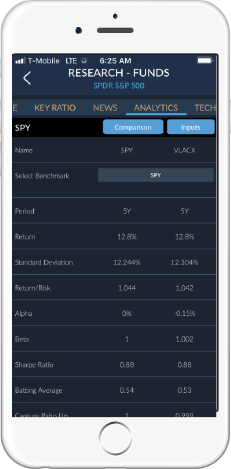
Deep dive into detailed analysis & comparisons
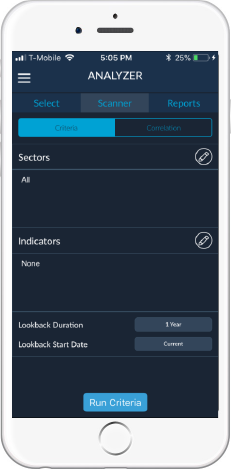
Zsenia has a built in Scanner that allows you to easily find stocks and ETFs that meet your criteria. Below are step-by-step instructions.
Go to Analyzer and then select Scanner
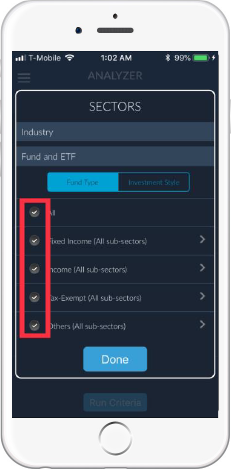
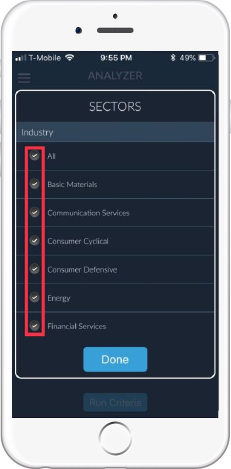
Select all for ETF Sectors.
Deselect all stock sectors.
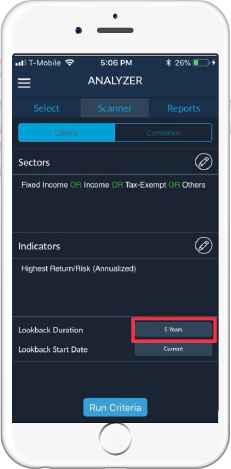
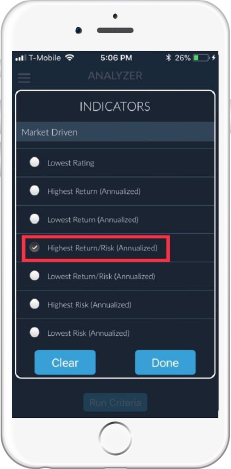
Select
Indicators

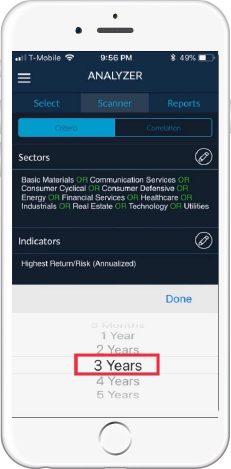
Select 5 years as the
Lookback Duration
You will get a list of tickers that meet the indicator
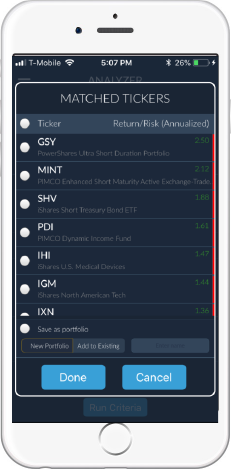
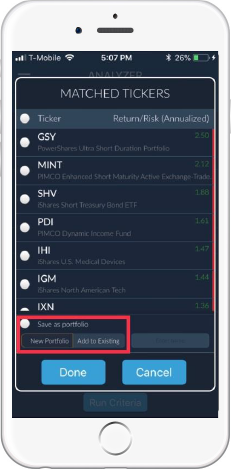
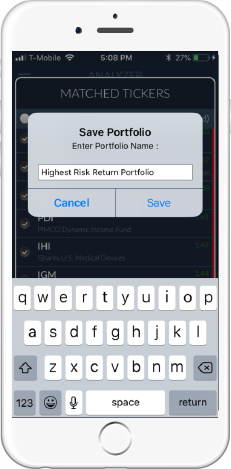
Select the top ETFs and save them as a new portfolio
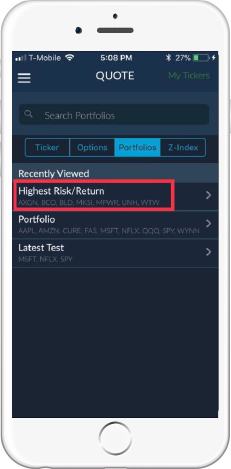
Select the portfolio from Quote under Portfolios. View the performance of the portfolio over time
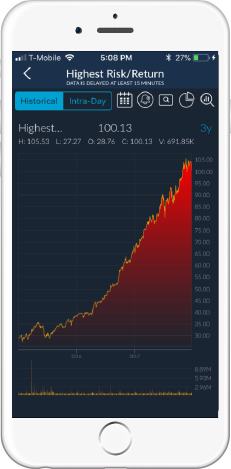
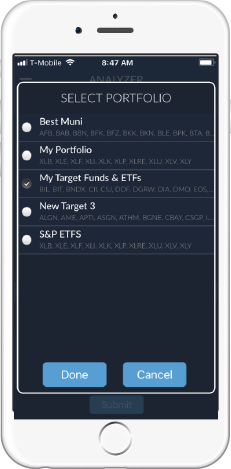
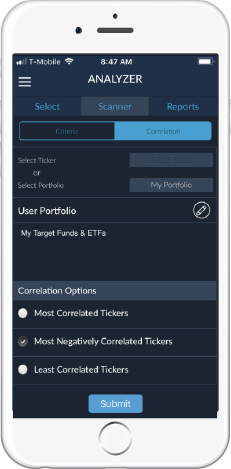
Zsenia’s Analyzer function is also great at looking for stocks that create more diversification to your portfolio. You can find stocks or ETFs that are most negatively correlated to your portfolio. This is especially important if you are looking to diversify and hedge your portfolio. You can also add stocks or ETFs that are not correlated or highly correlated to your portfolio. For instance, first create a portfolio composed of the ETFs/Funds that meets your requirements (e.g. Highest Return/Risk Portfolio for the last 5 years). You can name this portfolio anything (e.g. My Target Funds & ETFs)
Go to Analyzer and then deselect all Funds and ETFs
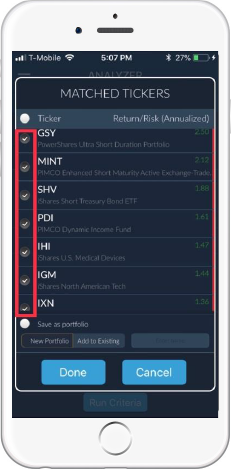
Select Highest Return/Risk (Annualized)
Select your Lookback Duration (3 years)
Select the top 7 stocks
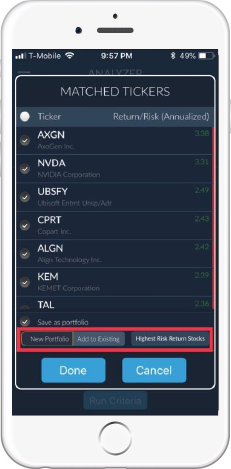
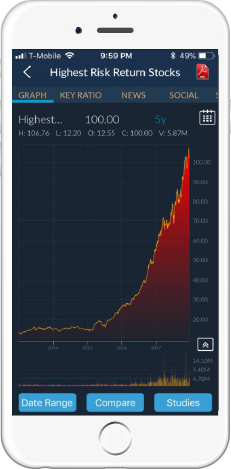
Compare against SPY by selecting compare
Select My Portfolio as base and
then use Pencil icon to
select My Target Funds & ETFs portfolio
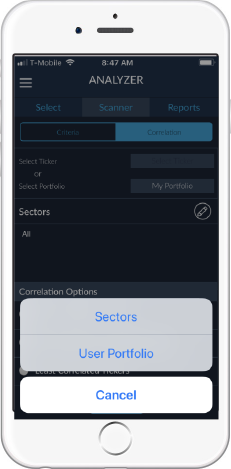
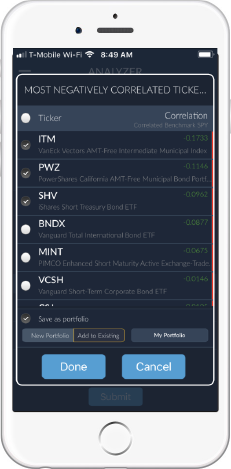
Select Most Negatively Correlated Tickers (option) and Submit to review the list of ETFs and Funds to add to your main Portfolio
Copyright © 2018. All Rights Reserved
Privacy Policy |
Terms & Conditions